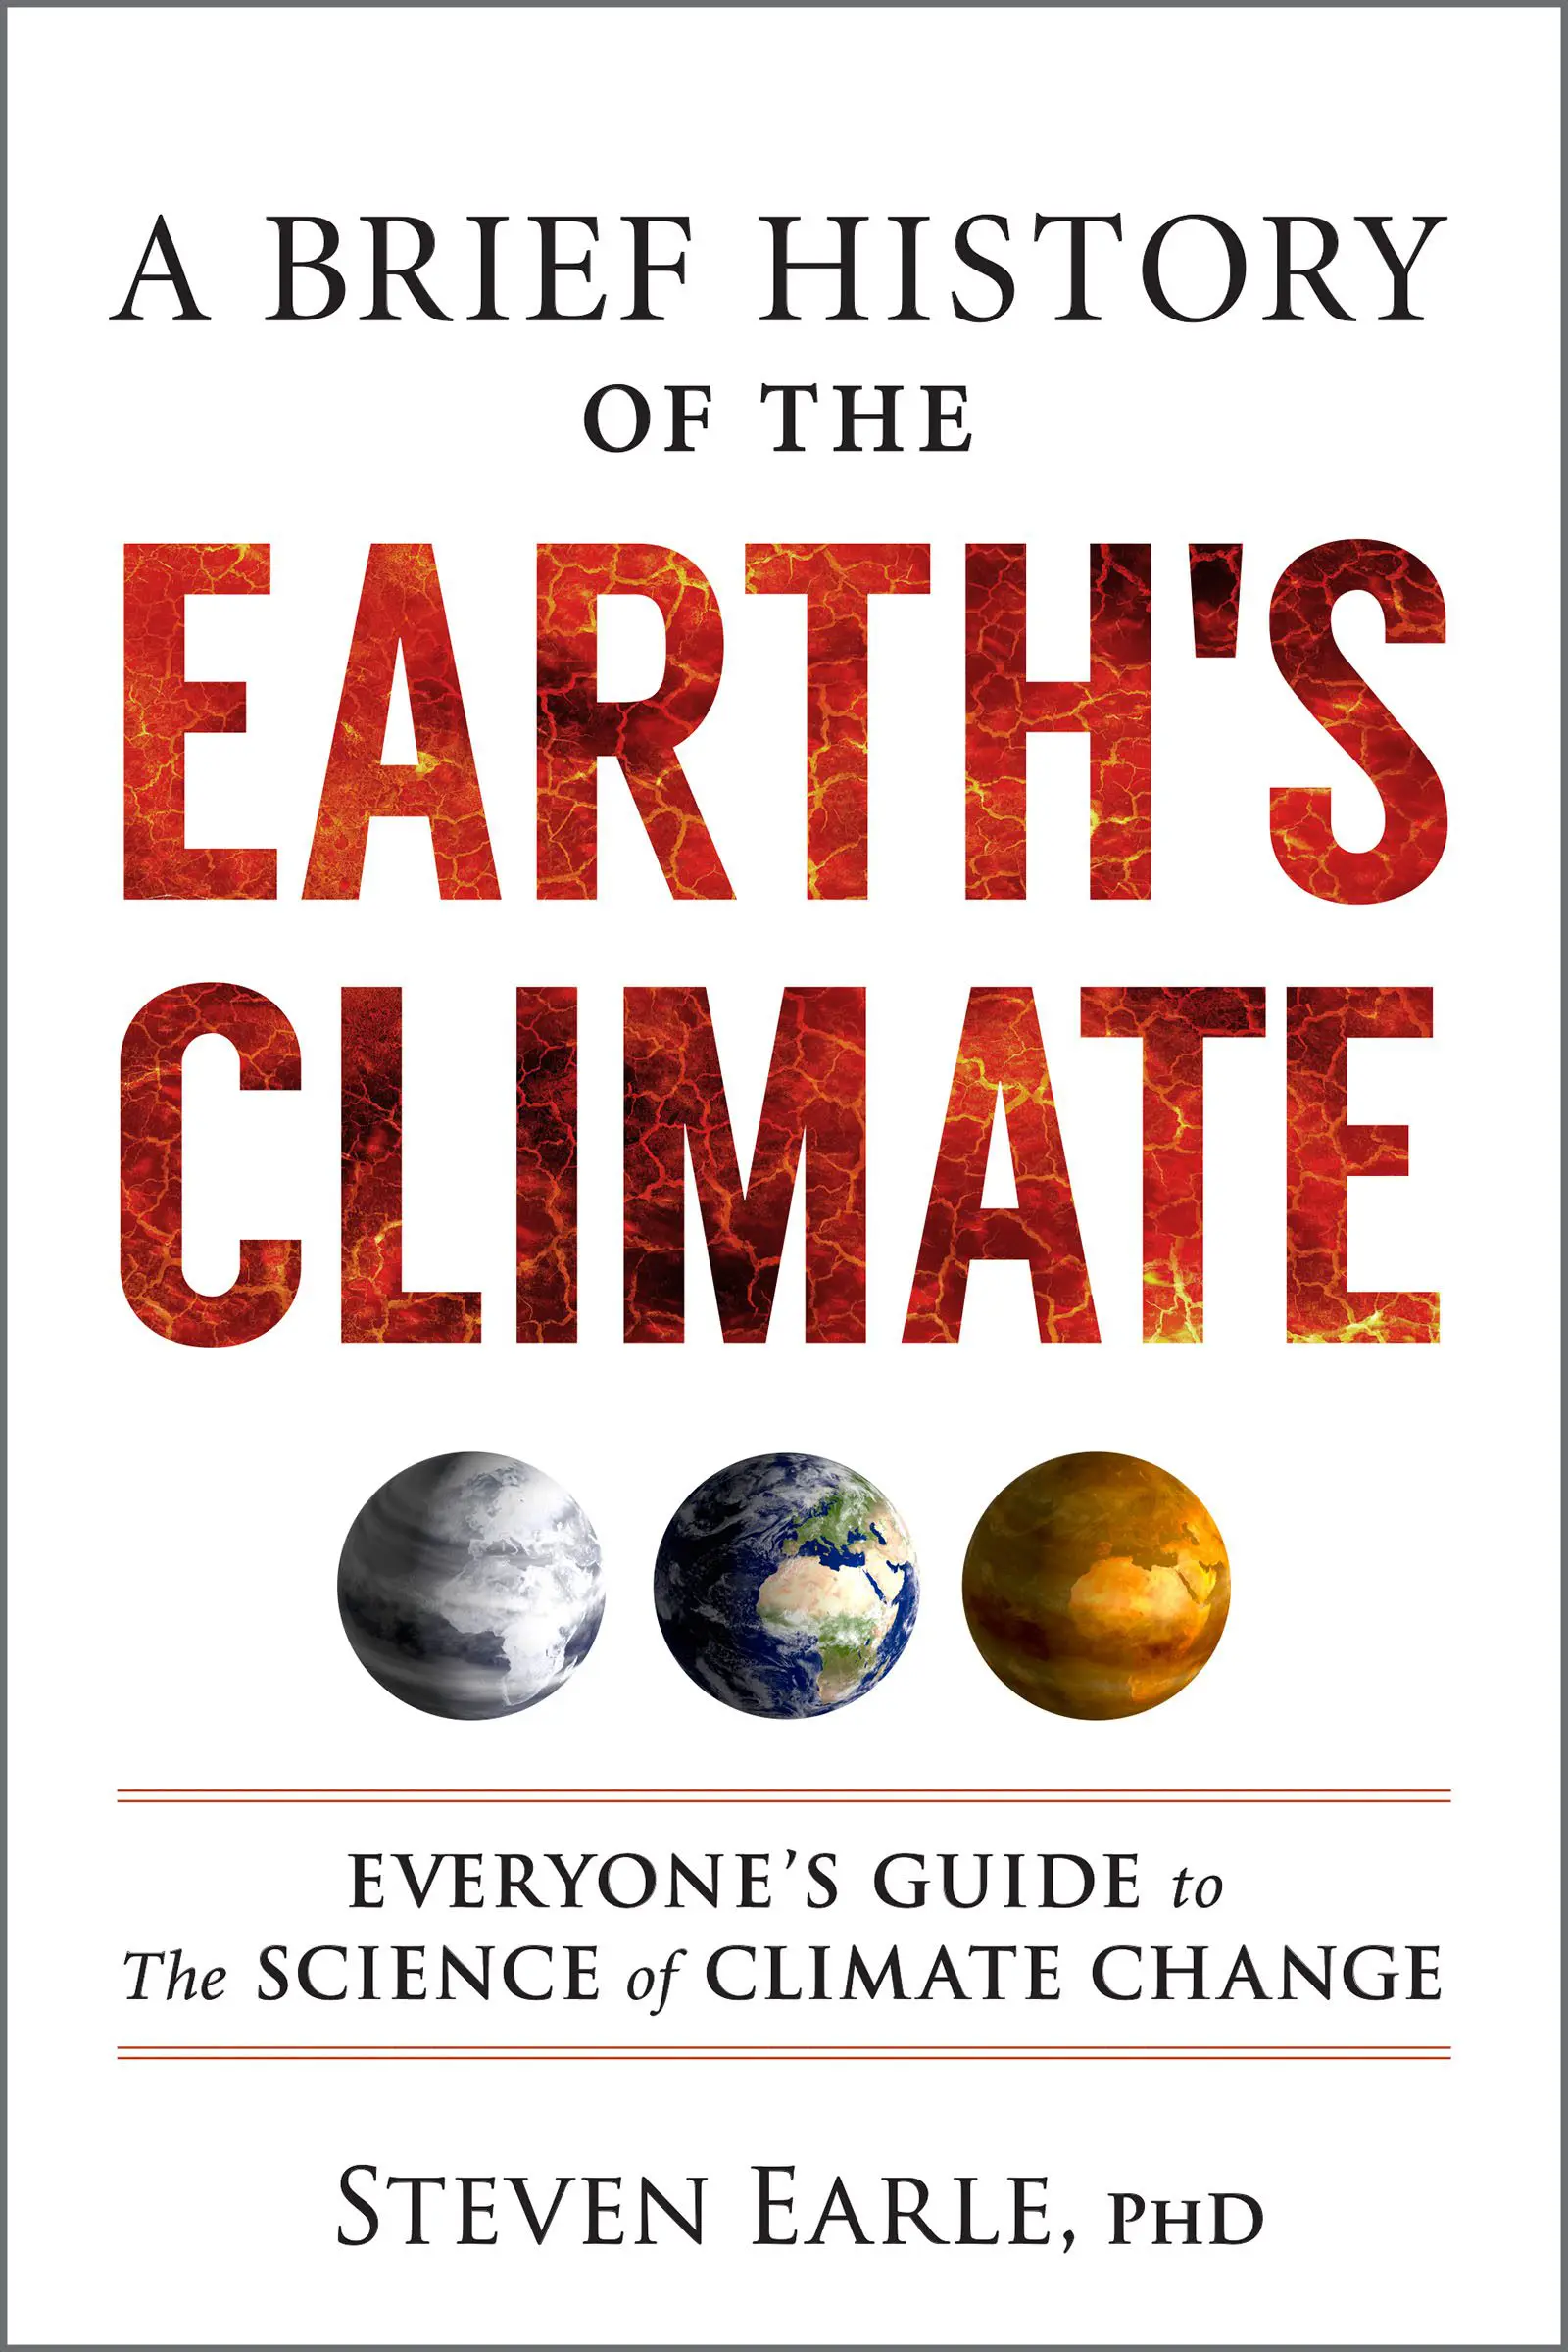
Has enough time passed to be able to talk about the pandemic without dread of another shutdown? While for many of us the last three years brings a lot of complex feelings, not everything related to COVID-19 was bad, particularly as it relates to the climate. Steven Earle was writing A Brief History of the Earth’s Climate as the pandemic unfolded, and captured some of the surprising impacts that the global shift had on the climate.
As NY Climate Week brings many more conversations about the changes necessary to mitigate the climate crisis, this excerpt serves as an important reminder that when we all work together, big shifts are possible.
More blogs from New Society Publishers
The Climate Impact of COVID-19
As I write this late in 2020, many countries are in the throes of a second wave of the COVID-19 pandemic. It is much more severe than the first time around, and since the case numbers are still trending upward in most countries, it appears likely to get even worse before it gets better. Health, social, business, democratic, and educational systems are seriously hobbled; hotels are mostly empty; nearly all cruise ships are tied up; and tens of thousands of commercial aircraft are grounded.
While these are difficult times for many people, there may be an upside to the COVID-related restrictions from the perspective of climate change. Many office employees are working from home (although, sadly, many people are not working at all), and many schools and universities have gone online, so road traffic is down, especially in countries where transportation is dominated by private cars, like the US and Canada.
The total distance traveled on US roads is monitored by the Federal Highway Administration of the U.S. Department of Transportation, and the numbers for 2020 and 2019 are shown on figure 11.6.
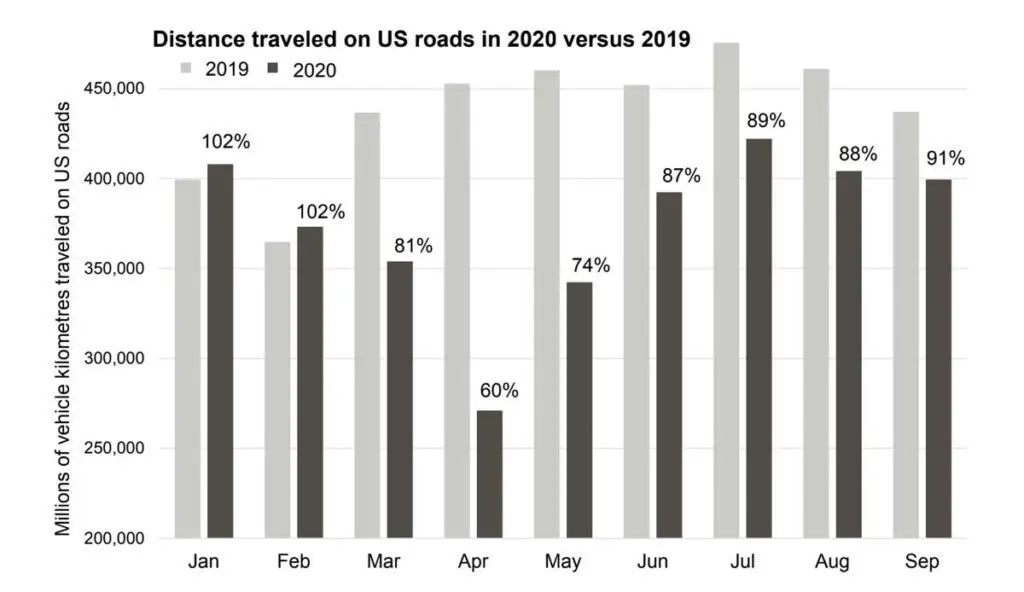
The roads were as busy as normal in January and February of 2020, but traffic dropped significantly in March, April, and May compared with the same months in 2019, with the lowest traffic in April at 60% of “normal.” Traffic recovered in June, July, August, and September to approximately 90% of normal levels. From March to September 2020, there was an average 80% decrease in traffic on US roads compared with 2019.
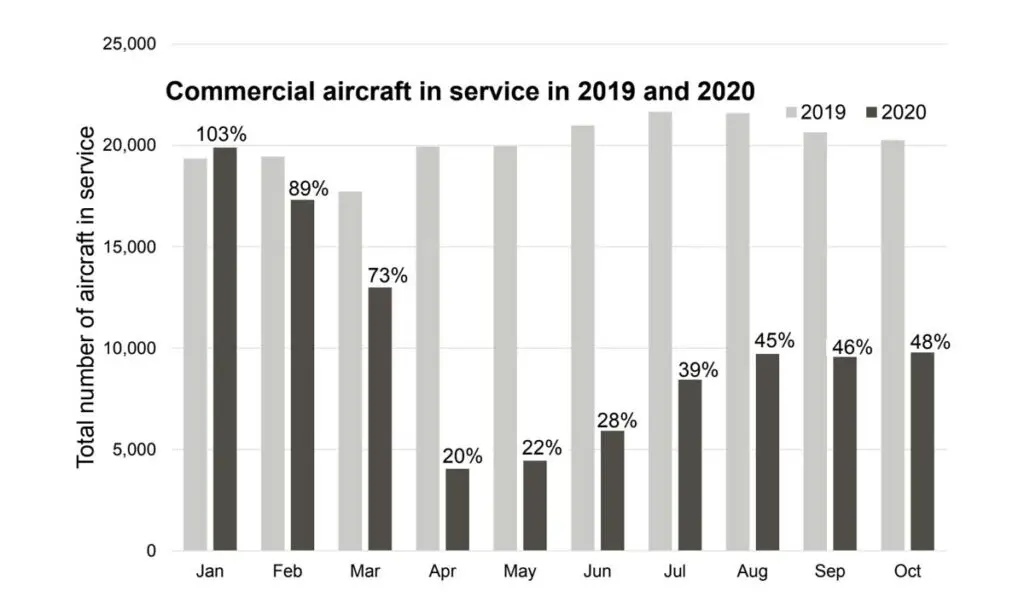
Demand for air travel dropped dramatically in 2020, largely because of COVID-related international travel restrictions and national policies discouraging business, social, and family gatherings. One measure of the decrease in air traffic comes from the number of aircraft in service as reported by the International Civil Aviation Organization. In January 2020, there were slightly more aircraft in service than in January 2019, but by April that number was down to 20% of the previous year (figure 11.7). The aviation industry recovered slightly over the spring and summer. On average, there were 46% as many aircraft in service in February through October 2020 compared with the same period in 2019.

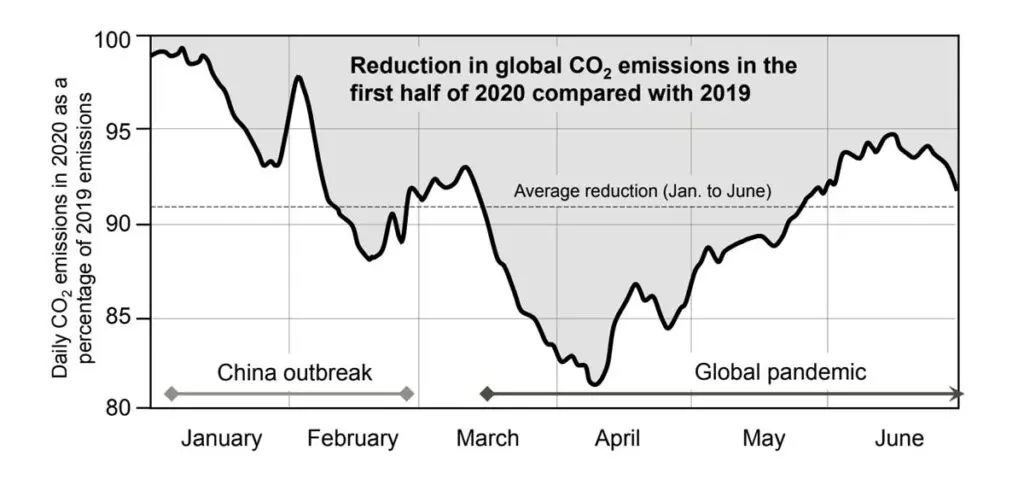
In a study published in October 2020, Liu and coauthors estimated CO2 emissions from various types of activities during the first half of 2020. They document decreases in emissions related to road and air travel that are similar to those described above but show that emission decreases in other areas were smaller: about 5% in electricity generation and industry and only 2% in buildings. They estimate that global CO2 emissions averaged 8.8% below 2019 levels during the first six months of 2020, with the lowest levels in April (figure 11.8). A report published in mid-December 2020 provides an update that there has been an overall 7% decrease in CO2 emissions in 2020 compared with 2019, the largest year-over-year decrease ever recorded.
Of course, the more important consideration is whether the observed drop in CO2-producing activity and the estimated drop in emissions has had any impact on the levels of CO2 in the atmosphere.
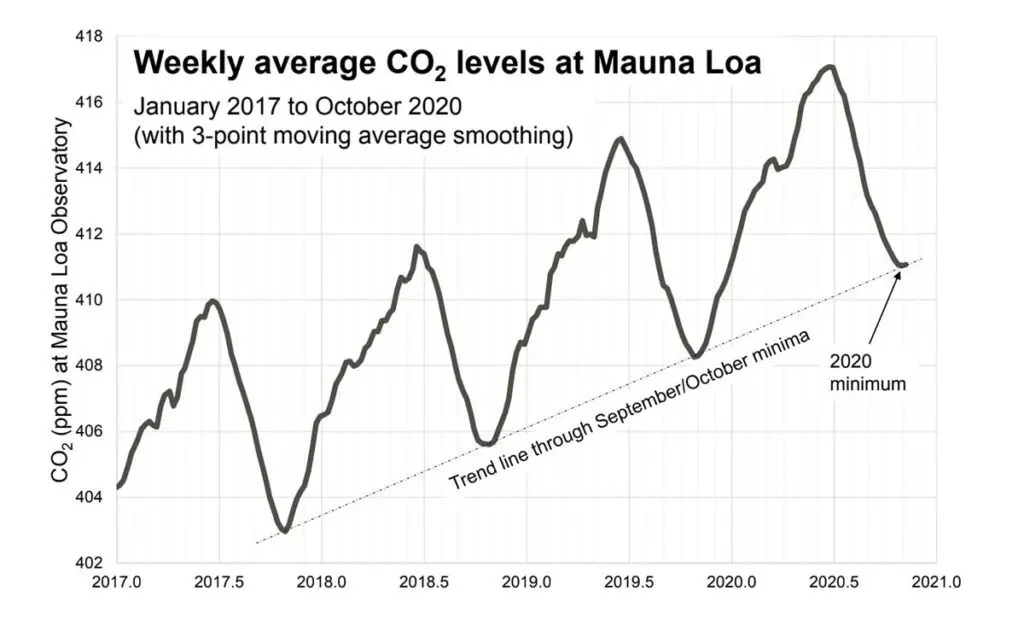
In fact, it’s too early to say. The sharpest emission decline in the past 50 years was during the recession of the early 1980s: an overall 11% drop in CO2 emissions from 1980 to 1983. This downturn did result in a slight reduction in the rate of increase of CO2 in the atmosphere, but that didn’t happen until late 1983 and into the middle of 1984.
The Mauna Loa CO2 curve for 2017 to 2020 is shown on figure 11.9. As of October 2020, there was no evidence of an inflection that could be related to COVID-19, although, based on experience from the 1980s recession, we wouldn’t expect to see that yet. If the COVID downturn in travel continues for another year or more, then we might see a small reduction in the rate of CO2 increase, but this is not the silver bullet that is going to slay climate change. Instead, it shows us that life can be bearable without a lot of discretionary travel, and that we need to take much more ambitious steps in that direction.
Of greater significance than a small and likely temporary reduction in emissions, COVID-19 has shown us that we do have the capacity to mobilize vast resources and the will to work together to get through a crisis. Governments have found the funds to help those forced out of work; hospitals and medical staff have been truly heroic; pharmaceutical scientists have worked at warp speed to design, test, and manufacture vaccines; and the majority of individuals have shown that they can modify their behaviors for the collective good.
If we can do this to fight COVID, surely we can bring the same kind of resolve and effort into the fight against climate change, which poses a much greater risk to our existence here on Earth.

